Falling Flat: The Not-So-Predictive Yield Curve

If you’ve been following recent market news, you’ve undoubtedly heard about the recent turmoil in the stock market. As we noted last week, 2018 was the first year in a decade that US markets finished lower than they started. This fact doesn’t mean a lot on its own, but it certainly doesn’t stop the talking heads from…well, talking. Pundits love to grab statistics and buzzwords that can generate a story, often plucking only the economic measures that support their case. One of the phrases you may have seen put forth, often as a harbinger of recession, is the dreaded “inverted yield curve.”
The story goes that once the yield curve flattens or inverts, the stock market is certain to take a downturn. Today, we’ll take a closer look at what exactly the yield curve measures and what (if any) predictive value it has.
Before we proceed, let’s take a moment to define a yield curve—for our purposes, we’ll specifically define the Treasury Yield Curve. The US Treasury issues notes, bonds, and bills of various lengths (maturities) to investors. These financial instruments all offer a rate of return (yield) that is based on a variety of factors, but typically is most heavily influenced by the amount of time the investor must wait to receive the return. The Treasury Yield Curve measures the return of these instruments versus maturity of each. Typically, the yield curve resembles the orange line on the following chart. The curve increases over time because an investor requires a higher return if they part with their dollar for a longer amount of time.
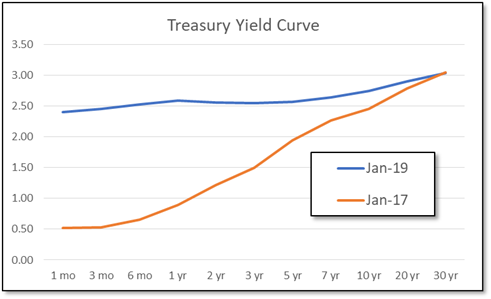
Sometimes, however, the Treasury Yield Curve looks more like the blue line. In fact, that’s what the yield curve looks like right now. The question is, why? There are many things that can affect the shape of the yield curve (Federal Reserve Policy, investors flocking to long-term bonds, etc.). While some say that an inverted yield curve is the best signal of an impending recession, its predictive nature of stock market performance is questionable. One of the most commonly cited statistics in favor of the relationship between the yield curve and stock market performance is that the last seven (or another number, depending on your source) recessions were preceded by an inverted yield curve. Upon closer examination, however, we can see that the length of time between an inverted yield curve and a recession is far from constant. Logically, we could also say that the last seven recessions were preceded by a presidential election, or by an AFC team winning the Super Bowl.
As we well know, markets go up, down, and sideways with time. Recessions happen. They have happened in the past and will happen in the future. That doesn’t mean that an investor should run for the hills every time the markets get a little jittery. The reasons are twofold. First, it is impossible to accurately predict exactly when markets will go down. For example, if an investor had moved to cash at the sign of an inverted yield curve in February 2006, they might feel smug about the ensuing 2008 market crash, until they realized they missed out on almost two years of positive market performance in the interim! The second reason is that even if an investor correctly timed their exit from the market (doubtful), they still won’t know when to get back in.
To wrap up, let’s take a look at some statistics that the researchers at Dimensional Fund Advisors, one of our strategic partners, have collected. Dimensional looked for yield curve inversions in various countries since 1985, and found that “In 10 out of 14 cases of inversion, local investors would have had positive returns investing in their home markets after 36 months. This is not much less than the historical experience of these markets over the same time frame, regardless of the shape of the yield curve. These results show that it is difficult to predict the timing and direction of equity market moves following a yield curve inversion.”
So, if the yield curve has no predictive value, what are we doing here at Yeske Buie? As always, we’re staying tuned into the goings on of the global economy, while staying grounded in our evidence-based investment philosophy. To start, we invest in a globally neutral portfolio, meaning that about half of Client portfolios are allocated to overseas markets. Furthermore, we address the cyclical nature of the stock market by incorporating short-term high quality bonds into our Clients’ portfolios. In the event of a prolonged economic downturn, this stable reserve can serve as a bridge to support spending for spending Clients. In the same situation, accumulating Clients can rely on their stable bond allocation to act as a source of funds to rebalance into stocks while the stocks are temporarily cheap.